CSSS Week One
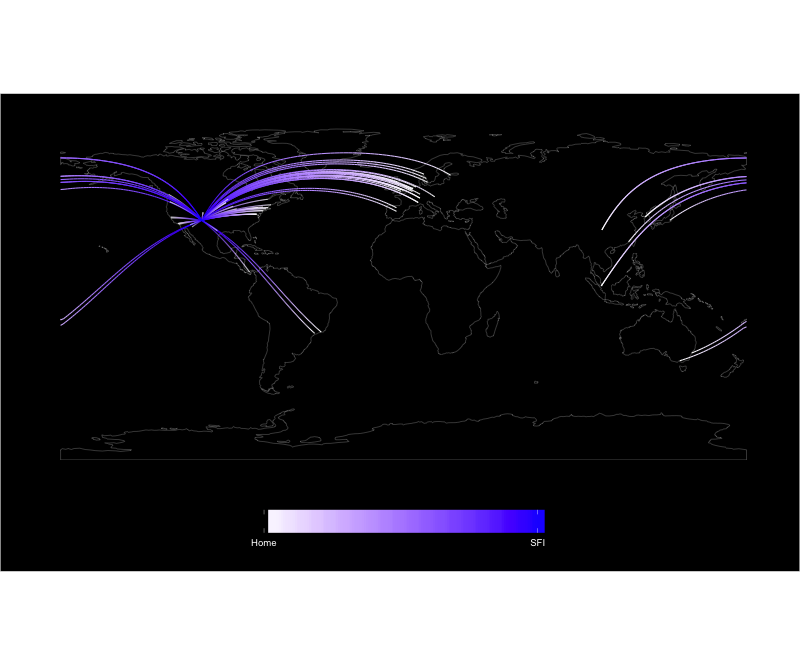 That strange attractor is the Santa Fe Institute. Each of those arcs represent the Great Circle route for all 66 participants. We come from all over. And yes, the image was done in R.
The first week ends tomorrow; we’ve spent all of our time at St. John’s College but tomorrow, we go to SFI. This week was mostly Physics, Phase Transitions and Non-Linear Dynamics. While I learned a lot in every course, the third lecture on Non-Linear Dynamics completely lost me. It was “delay coordinate embedding” and the “Takens Theorem” - mechanisms to analyze non-linear time series. I was pretty iffy before embedding and that just tipped me into a non-linear phase state of pure confusion.
Physics was pretty fun and a lot more conceptual - not quite Quantum Physics and “The Dancing Wu Li Masters”, but not Newtonian either. “Arbortrons” now make a little bit of sense to me, and the philosophical - hell, metaphysical - concepts of “what is thought” and “what is intelligence” (in a Physics lecture) were provocative. (“Thought” is making an almost connection complete, and the primary goal of “intelligence” is to collect energy). Oh, and I now have a theory (that I thought up) on why it is so hard to untangle coiled telephone cords. Mostly due to matter/anti-matter annhilation and the wave/particle nature of matter. Seriously.
Phase Transitions might prove practical to my business. A phase transition is a re-organizing of energy in a system (ice melts, iron magnetizes, &c). Using the Ising Model, I may be able to model the “energy” of a vacation market (“rented” implies energetic, “vacant” implies non-energetic), and then use all the math to compare the energies of two different markets (e.g. Breckenridge and Santa Fe) or one market at different times (December and July). Or it might be useless. But fun to try.
We also had a nice lecture on Mechanical Statistics - defined as a “branch of mathematical engineering concerned with drawing inferences from imperfect data””. “ We have one or two more to go; I’m able to follow this along OK.
We spent a lot of energy this week on organizing into project teams. I’m on two of them: Analyzing arXiv publications for structures in co-authorship, citations and language usage. The first two are going to be heavy graph and time-series analysis, which I want to learn. The language area is a bunch of NLP goodness which I think I can contribute to. My other project is modelling the resilience of cities experiencing some level of disaster. This is an other graph analysis project along with agent-based modelling of the citizens as they react to the disaster. I suggested we model a “non-stationary biological event” as the disaster - you know, something like Godzilla. We’ll probably do “floods”, especially as the waters rise and an inconvenience turns into an evacuation.